Load Balancing in Exchange Server 2016

Similar as when TMG was EOL, and people were asking how should they publish Exchange services now, now we have a similar question with load balancing of Exchange Server, since support for Windows Network Load Balancing is no more. Architectural changes in Exchange Server 2016 which resulted in having only one server role now (now even Client Access Server is integrated with Mailbox Server) makes impossible WNLB for usage. Reason is simple – you can’t use WNLB and Failover Clustering (required by DAG) on the same pair of machines. However, to be honest, even if this is not the case, WNLB is not a solution that I’d recommend for Exchange load balancing to anyone. It’s too old with too many issues for a critical service like Exchange.
So, obviously, we need an external solution for load balancing client access traffic. In most cases, we are actually talking about HTTPS based traffic, as most Exchange traffic (except for SMTP) is using this protocol.
With Exchange 2013 Microsoft announced that it is not required anymore to go with expensive Layer 7 load balancers for Exchange – you can also use cheaper and simpler Layer 4 balancer for client requests. What’s even better, there’s no need for session affinity anymore. This is because client access services now proxy the connection to any Mailbox Server, and it doesn’t really matter where client actually establish the session. This simplifies the requirements for Exchange load balancers even more.
Let’s see what is the real difference actually, and why should you care about this anyway. You might be surprised that main issue here is actually node health check. Luckily, Microsoft provided a very intelligent way to handle this even with cheap (or free) load balancers. As I’m currently writing a course on Exchange 2016, I’ll use some of my draft materials to clarify this.

Load balancers that work on Layer 4 are not aware of the actual traffic content being load balanced. The load balancer forwards the connection based on the IP address and port on which it received the client’s request and it has no knowledge of the target URL or request content. For example, load balancer on the Layer 4 does not recognize if a client is connecting with Outlook on the Web or with Exchange Active Sync as both connections are using the same port (443). Also, load balancers on the Layer 4 are not able to detect the actual functionality of the server node that is included in load balancing pool. For example, Layer 4 load balancer can detect if one of the servers from the pool is completely down, because it does not responds to PING, but it can’t detect if IIS service on that server is working or not. From the client access perspective, if IIS is not working on the server, it is almost the same as the server is done. However, it will not be marked down by Layer 4 load balancer in this case. Some Layer 4 load balancers can provide simple health check by testing availability of a specific virtual directory, such as /owa, but functionality of one virtual directory does not guarantee that others are also working fine.

Load balancers that work on the Layer 7 of OSI model are much more intelligent. Layer 7 load balancer is aware of the type of traffic passing through it. This type of load balancer can inspect the content of the traffic between the clients and the Exchange server. From this inspection, it gets that results and uses this information to make its forwarding decisions. For example, it can route traffic based on the virtual directory to which a client is trying to connect, such as /owa, /ecp or /mapi and it can use a different routing logic, depending on the URL the client is connecting to. When using a Layer 7 load balancer, you can also leverage the capabilities of Exchange Server 2016 Managed Availability feature. This built-in feature of Exchange monitors the critical components and services of Exchange server and based on results it can take actions.

Managed Availability uses Probes, Monitors and Responders as components that work together. These components test, detect, and try to resolve possible problems. Probe component is used first. It tries to gather information or execute a diagnostic tests for a specific Exchange component. After that a Monitor component is used to evaluate the results that Probe provides. Monitor uses the results information to make the decision whether the component is healthy or unhealthy. If a component is unhealthy, a Responder component can take measures to bring that failed component back to a healthy state. This can include service restart, database failover or, in some cases, server reboot.

If a critical server component is healthy, Managed Availability generates a web page named healthcheck.htm. You can find this web page under each virtual directory, for example, /owa/healthcheck.htm or /ecp/healthcheck.htm. If Managed Availability detects that server component is unhealthy, the health check web page is not available and a 403 error is returned. You can use this to point your load balancer to the health check web page for each critical service.

Layer 7 load balancer can use this to detect functionality of critical services, and based on that information decide if it will forward client connections to that node. If the load balancer health check receives a 200 status response from health check web page, then the service or protocol is up and running. If the load balancer receives a 403 status code, then it means that Managed Availability has marked that protocol instance down on the Mailbox server.

Although it might look that load balancer actually performs a simple health check against the server nodes in the pool, health check web page provides an information about workload’s health by taking into account multiple internal health check probes performed by Managed Availability.

It is highly recommended that you configure your load balancer to perform the node health check based on information provided by Managed Availability feature. If you don’t do this, then the load balancer could direct client access requests to a server that Managed Availability has marked unhealthy. At the end, this results in inconsistent management and negative user experience.

Changing certificate on AD FS and DRS


If you have AD FS with Device registration service (DRS) configured on your Windows Server 2012 R2, you might have experienced troubles if you decided to change the certificate on AD FS server. Although AD FS management console will allow you to change service certificate for AD FS, it will not let you change the SSL certificate, nor it will allow you to assign rights for group managed service account used by DRS to access the private key of the new certificate. As a result, change of AD FS service certificate only through the AD FS console will make your DRS stop working (and your devices incapable to perform Workplace Join). So, if you want to change this certificate, for whatever reason you have, there is a procedure to follow:

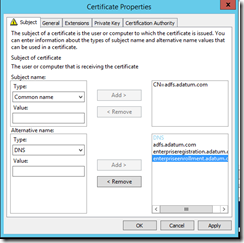
1. First, during certificate enrollment process for the new certificate make sure that you assign rights to access the private key. This is not very obvious thing to do, actually. When you start the certificate request procedure on your AD FS server, choose Web Server template, and then enter its properties to configure more settings. On the Subject tab, make sure that you type all names that you need. First, you need the name of your AD FS cluster (or server), for example, adfs.adatum.com. Make sure that this name is not the same like your AD FS server name. Also, you need this same name as SAN (Subject Alternative Name), and also enterpriseregistration and enterpriseenrollment SAN host names (second one is for Windows 10). See example below:

clip_image001

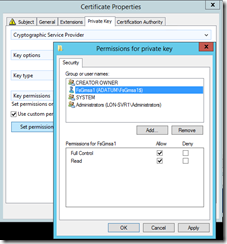
2. Then, go to the Private Key tab, expand Key Permissions and select Use custom permissions check box. Click Set permissions, then Add, and then select Service accounts as object type, and type your group managed service account that you created when you first configured DRS. See example below :

clip_image002

My group managed service account in this example is FsGmsa1 in Adatum.com domain. When you configure this, finish the enrollment of certificate.

Note : Make sure that this service account has SPN set to your ADFS cluster name. You can check that with following command : setspn –l adatum\FsGmsa1$. Result should something like this:

host/adfs.adatum.com
http/adfs.adatum.com

3. When you finish the certificate enrollment, while you still have Certificates console open, double click the new certificate. Go to Details tab, and scroll down to Thumbprint attribute. Copy the thumbprint value to Notepad, and remove spaces between pairs of characters.

4. Now you have to issue two PowerShell commands to setup new certificate to work with AD FS. First command is :

Set-AdfsCertificate -CertificateType Service-Communications -Thumbprint “your_new_certificate_thumbprint″ – this will set your new certificate as AD FS service certificate. This part you can also do by using AD FS Management console.

Second command will change your SSL certificate for AD FS (that’s the one you need for AD FS, and the one you can’t change with console):

Set-AdfsSslCertificate –Thumbprint “your_new_certificate_thumbprint″

When you finish this, you will be good to. Restart your AD FS and DRS services, and they should start successfully.

Refreshing templates and testing Azure RMS

If you are using Microsoft Azure RMS service together with Office365, in order to extend functionality of basic RMS in Office365, you probably do it to create customized RMS templates. If you activate Office365 Rights Management, it will let you use only two default templates for content protection, and one template for email protection (Do Not Forward). Some users might be fine with these capabilities, but if you want more like on-premise RMS features, you’ll probably want Azure RMS. When you enable Azure RMS with your Office 365 subscription, it will let you create custom templates for RMS. However, if you are like me, and like to play around and make changes frequently, you might want check to speed up Azure custom RMS templates sync to Office365. Also, it might be useful to check and test your Azure RMS configuration from time to time. Luckily, there are few nice Powershell cmdlets that can be used for this purpose.

First, you need to connect to your Office365 tenant. To first store your credentials in PS variable, issue this cmdlet:

$cred = Get-Credential and press Enter. After this you will be prompted to enter your Office365 admin credentials. When you do it, type this:

$Session = New-PSSession -ConfigurationName Microsoft.Exchange -ConnectionUri https://outlook.office365.com/powershell-liveid/ -Credential $cred -Authentication Basic –AllowRedirection, and press Enter. This will create a session to your Office365 tenant and also store in in Session variable.

Next, you want to import your session, and you will do it by executing Import-PSSession $Session cmdlet.

To check your RMS configuration, just execute Get-IRMConfiguration cmdlet after you imported a session in previous step. Check if internal and external licensing are enabled and also check for the RMSOnlineKeySharingLocation ( for Europe , it should be: https://sp-rms.eu.aadrm.com/TenantManagement/ServicePartner.svc). Besides this, it is useful to test your RMS configuration by executing Test-IRMConfiguration –RMSOnline cmdlet.

If all test are passed, and you want to force sync of your new/changed/deleted templates from Azure RMS to Exchange Online, here is the cmdlet :

Import-RMSTrustedPublishingDomain -Name "RMS Online – 1" -RefreshTemplates -RMSOnline

Make sure that the name of RMSTrustedPublishingDomain is accurate (if you used default values it will be like in example above).

Exchange publishing after TMG/UAG

After Microsoft announced that they will not be developing ForeFront Threat Management Gateway (TMG) anymore, and that this product, together with UAG is end-of-life (you can see more about this here), a lot of people I work with were pretty confused. To most of them, words “end-of-life” sounded like “not supported anymore” which is not the fact. However, from technical perspective, most clients I work with were worried about how to publish Exchange server without TMG.

In this post, I will try to cover most common scenarios with Exchange+TMG and ways how to handle these scenarios in near and far future. You’ll see that things are not as black as they might look at first sight.

First, let’s remind ourselves what TMG actually does for Exchange server. TMG 2010, as firewall/proxy/caching solution, is, among other things, capable to provide application level publishing for Exchange Server, instead of doing that just on transport layer. This means that instead of just forwarding (and protecting) HTTPS and SMTP traffic to your Exchange, TMG is actually “aware” that it has Exchange behinds its back. Because of this fact, it can impersonate Exchange server in some scenarios (for example, for OWA), terminate client connections on itself, authenticate users and then connect to Exchange to fetch the content for the user. TMG is using, so called, listener components to securely publish Exchange (and other) services to the Internet. For the Exchange publishing scenario, listener component is, for example, able to generate form based authentication page for OWA, securely authenticate a user, and then establish the connection to the Exchange server CAS. Besides, TMG was also able to securely publish your SMTP or SMTPS to the Internet, as well as to protect that kind of traffic from malware. This kind of publishing was very convenient for a lot of companies. I mostly work with medium to large companies, and quite a lot of them were using TMG to publish Exchange servers to the Internet, because solution is affordable, reliable, easy to deploy and manage and showed up to be very secure. Of course, there some downsides of using TMG for other purposes, but quite often I was seeing dedicated TMG just for Exchange publishing. In much more rare cases, UAG was also used to protect Exchange, but since it is also EOL, situation is actually the same.

The question we have now is what to do with Exchange publishing in post-TMG/UAG era. So, let’s see some most common scenarios you might run into.

Scenario 1: You already have TMG 2010 and Exchange Server 2003/2007/2010 deployed. What are your options? I want to be very clear on this point: Although TMG is end-of-life product, this does not mean that you have to look for another solution immediately. TMG 2010 will still be supported until year 2020, per support lifecycle policy for this product. This gives you quite a lot of time to find another solution, while still using fully supported configuration. So, no reason to panic, there’s a plenty of time left to think about other options. Make sure that you update your TMG server on regular basis, and you’ll be fine.

Scenario 2: You already have TMG 2010 and Exchange Server 2003/2007/2010 deployed, but you are planning an upgrade to Exchange Server 2013, and you know that TMG does not natively support Exchange Server 2013 publishing. What should you do? Yes, it is true that TMG does not support Exchange Server 2013 publishing out-of-the-box, but there’s pretty simple solution to make it work. First, you don’t need to worry about SMTP publishing – it works as before. You just have to direct your SMTP publishing rule to Exchange Edge server (available only in Exchange Server 2013 SP1) or to Client Access Server (if you don’t have Edge, in version 2013, incoming SMTP is handled by CAS server in Exchange 2013). For publishing Exchange web-based services, such as OWA, OA or Active Sync, you’ll have to run new publishing wizard, select the option to publish Exchange 2010 (as you’ll not have 2013 available), and after you create the rule, you will have to do some small fixes in publishing rule you just created. There’s a great post from Greg Taylor, Principal Program Manager from Exchange PG, that covers this, step-by-step, and you can find it here. Basically, in most cases, you’ll just have to adjust the URL for OWA logoff, which has changed in Exchange 2013. However, if you decided to go with latest and greatest technologies, and use MAPI over HTTP functionality (supported only when using Exchange Server 2013 SP1 with Outlook 2013 SP1), you will also have to add /mapi/* virtual directory path to Outlook Anywhere publishing rule, as this folder was not published before by Exchange publishing wizard. This is not mandatory thing to do. Exchange Server 2013 SP1 can also work with MAPIoverRPCoverHTTPS client connections, like Exchange 2010, but if you have Outlook 2013 SP1 clients you can also enable MAPI over HTTP as it brings several performance and stability enhancements. You can see more about this in great article by Tony Redmond here.

Scenario 3: You already have some 3rd party publishing solution in production, for Exchange Server 2003/2007/2010 publishing, and you’re planning to upgrade your Exchange organization to Exchange Server 2013. In this case, most important is to test your current solution with Exchange Server 2013. It might require some modification to the current publishing configuration, but in most cases, you will be good to go with what you have. If your current solution can’t work with Exchange Server 2013, or you want to replace it for any reason, look for the next scenario.

Scenario 4: You are planning to deploy Exchange Server (in any version) but you don’t have a publishing solution or your current solution does not work with version of Exchange you’re about to deploy and publish. In this case, things can be a bit complicated. First, you should be very clear on what you’re publishing. For the Exchange server, in most cases, you will want to publish SMTP (so your Exchange can receive emails from the Internet) and HTTPS-based services such as Outlook Web App, Outlook Anywhere, Exchange ActiveSync and, in some less frequent scenarios, Exchange Web Services. One of the very nice features of TMG is that it is capable to securely publish all these services, while providing attack protection at the same time. But, you are not able to buy TMG anymore. As said before, it is still supported, but not on the market to buy anymore. That leads us to situation where we must find solution to securely publish SMTP and to publish HTTPS based services. If you are looking for hardware (or virtual) appliance to solve this, most likely, you’ll have to look for two solutions instead of one, like with TMG. You will need one solution for publishing of web-based Exchange services, and another solution for securing and publishing the SMTP. In this case, budget becomes a very important factor. So, let’s look a bit deeper into these scenarios.

Scenario 4.1: You have a very limited budget, but you need a solution that works. I hear this all the time J. Well, actually there are solutions for this scenario, which can be almost free. Instead of using TMG (which was, by the way, pretty affordable), you can achieve reverse proxy functionality by using Application Request Routing component for IIS. This is an extension for IIS in Windows Server 2008, Windows Server 2008 R2, and Windows Server 2012, and it’s free. To use quote from Microsoft, IIS Application Request Routing (ARR) 3 enables Web server administrators, hosting providers, and Content Delivery Networks (CDNs) to increase Web application scalability and reliability through rule-based routing, client and host name affinity, load balancing of HTTP server requests, and distributed disk caching (end of quote). Well, we can also use it to load balance and publish Exchange Web services. It is not complicated for deployment, and if you choose to go this way, you can find a very good guide on how to configure it here. You might have noticed that ARR is not supported on Windows Server 2012 R2. This is because 2012 R2 provides another technology for similar purpose – Web Application Proxy. Unlike ARR which is an extension to IIS, WAP is the subcomponent of Remote Access role in Windows Server 2012 R2. It actually replaces AD FS Proxy from previous Windows versions, but it also provides some publishing functionality. WAP is free, as it is included in Windows, but it requires some more administrative time to deploy and configure. It requires that you deploy AD FS on separate machine to make WAP work. With WAP, you can also use AD FS based authentication. If you have Exchange only on-premise, this might not be very attractive option, but for hybrid deployments with Office365, WAP is a great solution. If you decide to give it a try, you can find good step-by-step instructions to set it up here. However, ARR and WAP can’t publish SMTP for your Exchange server, so you will need another solution for that.
For the SMTP, you’ll need to address multiple keypoints. From the aspect of Exchange, it is very important if you are using Edge role or not. If you are, then you can deploy Edge server (or servers) in DMZ, and publish SMTP on the firewall. You can activate anti-spam agents on your Edge server, and stop most of the dirty SMTP traffic before it enters your internal network. However, you still have to deal with antivirus protection. As a part of Microsoft decision to shut down Forefront family of products, Forefront for Exchange server is also not available anymore. You can go with a third party antivirus solution, or you can choose Exchange Online Protection from Microsoft. If you don’t already have some on-premise AV solution I recommend that you seriously consider Exchange Online Protection. Yes, I know, that emails are going through Microsoft servers before they reach you, I’ve heard this argument a hundreds of times, with all variations of NSA-related conspiracy added to the story. I’m not going to elaborate on that, but will just say that if your email will be going through Microsoft servers before it reaches your Exchange, that will certainly be one well-known point in its path. Do you know anything about others?

Scenario 4.2: You have some budget to spend on Exchange publishing solution. Good for you J. In this case, I recommend that you look for some solutions from F5 and Kemp. I’m not actually promoting any of their products, but in Exchange community these are proven to be reliable and secure solutions for Exchange publishing. With some of the products they are offering, you can publish and load balance both HTTPS and SMTP. Also, if you are looking for a good (but not cheap) SMTP AV/AS/gateway solution, you should definitely check on Cisco Ironport Email Security appliances. I’ve seen these working in a production, and I’m pretty amazed by effectiveness they provide.

Feel free to comment on this article. I tried to summarize some solutions, based on my from-field experience so far. I’m not saying that this is all, but I hope it will help some people to go in to the right direction.

My sessions on upcoming conferences

After delivering very successful four CloudOS events in Sarajevo and Belgrade, with great audience, I’m heavily engaged in preparing sessions for spring conference season in EE region. This year, 4 conferences are happening in very short time frame (10 days), all of them are really great and I highly recommend that you visit at least some, if not all, of them.

tarabica It all starts with first Serbian Community-driven conference called Tarabica. It will happen on April 5th in Belgrade, it is fully organized by Serbian community guys and MVPs, and I’m sure that it will be a great event. It happens on Saturday, so you don’t have to ask your boss for permissions to attend :). On this conference, I will deliver a session about managing smart cards with ForeFront Identity Manager 2010 R2. You can see more about this session (and also register for a conference) here.

WD Right after Tarabica conference, one of the largest Microsoft official conference in region starts – Windays14. This year, again in Umag, beautiful place on Croatian coast. Last year it was very nice there – great place, excellent speakers a lot of fun, and I’m sure it will be same or better this year. On this conference, I’ll deliver a session about BYOD technologies in Windows Server 2012 R2 (session details are here) and also a session about how to efficiently build and manage internal PKI (session details are here).

NTK In the same week as Windays (but starting from Wednesday) Slovenian Microsoft NTK conference will happen. This is the conference with longest history in this region (I think this one is 19th), and it always attracts a lot of people. It happens on Bled, beautiful place on the famous Slovenian lake. On NTK conference, I will deliver a session about using Dynamic Access Control in production environments (session details are here), and a session about how to efficiently build and manage internal PKI (session details are here).

MSN And last, but definitely not less important, in the second week of April, fourth Bosnian Microsoft Network will happen. In the same place as last year (Banja Vrucica hotel resort), MSN4.0 will offer even better content and really great speakers from the whole region. Besides teaching there, I was also a member of content team, and I’m really satisfied with what we have done content wise. I’m very interested to see attendees feedback this year. On this MSN4.0 conference I will deliver a session about Windows Server 2012 R2 as a CloudOS (session details are here) and a session about upgrading to Exchange Server 2013 (session details are here). Besides these official sessions, I will also co-deliver one case-study session about Exchange&ADRMS implementation project in BH Telecom, that I was leading, together with a team member from customer side.

As you can see, a lot of presentation work is in front of me in next few weeks. Although preparation for all this sessions is not an easy job, I’m really looking forward to see my friends, colleagues and fellow MVPs from Serbia, Croatia, Slovenia and Bosnia.

See you there!!

CloudOS MVP Roadshow events – here we go again…

image

After I delivered many Windows Server Roadshows in Bosnia and Serbia last year, and had a great time with participants, I’m very happy and proud to announce that we are set to go again – this time to cover Windows Server 2012 R2 as a Cloud OS.

Every day, more data is generated on many types of devices. Every day, IT administrators and engineers are dealing with various requests and ways to manage data and devices that host the data. More and more apps and services used and installed on premise, are extending to the cloud. To help IT people to work more efficiently in the era of cloud services and BYOD concept, Microsoft provides the CloudOS – Windows Server 2012 R2.

During two whole day events (totally free for community members), one in Sarajevo (Feb 18th – Logosoft CPLS) and one in Belgrade (Feb 10th – Microsoft Serbia) we will explore the concept of CloudOS, see how to enable people-centric IT and will dive into technical benefits that Windows Server 2012 R2 provides. With lots of examples and demos, you will have a chance to see how to protect data in BYOD concept by leveraging technologies in Windows Server 2012 R2 for data access, device management and data protection. Also, we will discuss new approach to storage management with built-in storage technologies in Windows Server, as well as how to efficiently implement VDI in Microsoft based environments. And last, but definitely not less important, you will be able to see new Hyper-V platform with its new features!

So, if you are interested in these topics, I’m sure we will have a great time exploring them again. Registrations for Serbia and already out, stay tuned for Bosnia – we will send invitations soon.

Lepide File Server Auditor – file servers under surveillance

After I wrote last month about Lepide Event Log Manager, this time there’s another interesting software from the same company, intended for surveillance of file servers.
The ability to monitor the changes that occur in the resources that the file servers host is very useful, especially in situations when it comes to critical documents and content. Basic auditing that Windows Server provides through its group policy and object access auditing can provide basic information, but to locate and correctly interpret information can often be time consuming and sometimes problematic.
Therefore, the existence of a dedicated software that is focused on this type of surveillance and monitoring, for many organizations is very useful.

Similar to the Event Log Manager, File Server Auditor shares similar simple and intuitive interface and relatively lightweight configuration. Upon completion of the installation and configuration of this software, which is very simple and has pretty light hardware requirements, it is necessary to add file servers that are being monitored, and to install the agent on them, using the appropriate credentials. After that, it begins the process of real-time monitoring of changes occurring at the server, according to the adjustments that you made in the File Server Auditor console.

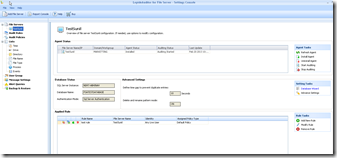
Setting console1

File Server Auditor as a central element upon which the monitoring is conducted is using rules to control auditing (Audit Rules). Audit rules are formed from multiple components. It is therefore advisable before forming any rules for auditing, to first configure rule sub-components, except in the case when one wants to leave everything on default values ​​(which means to monitor everything all the time, which perhaps is not always the best option). If you prefer a more detailed approach, it is possible to configure the following elements:

Lists

· Events: At this point you configure the type of events that you want to follow. For example, files that are opened, red, modified, deleted, renamed, and changes in SACL and DACL lists. Similar events can be tracked for folders as well. Default event list includes all supported events, which generally results in a pile of logs, so it is wise to narrow this list for a bit.

· Process: It is possible to configure processes that generate changes to the file server resources. Again, by default they are all selected, or if you are interested in some specific, the choice can be set to specific.

· File Name & File Type: As you would expect, it is possible to filter by file type (which is determined by specifying extensions) or by the name of the file (in which case we can also use wildcards). This can be specified in order to achieve control only over certain files and folders that match your criteria in defined filters.

· Directory: If you follow the resources contained within a particular folder on the file server, in this place you can determine which folder you want to audit. At the same time it is possible to form a list of one or more folders whose contents we want to follow.

· Drive: You can also adjust the letter of the drive on the server that is carried out auditing. Since this can vary from server to server, and other options provide ample opportunities for precise filtering, this can be left at the default value, which includes all the drives. Alternatively, it may be possible to disable the system drives (which is usually the letter marked C) and thus focus only logging to files on other drives.

· Time: The last element (ie the list, as it is called in the console) is an option to define the time range for auditing. Although it is by default set to do the monitoring continuously, it is possible to change and the option to define instance so that auditing is done only at certain intervals.

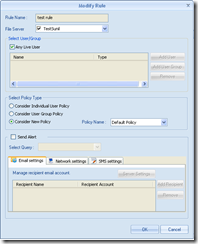
From these elements you form the Audit policy and finally the Audit Rule, which contains a list of servers that are being monitored, the identity of users who you want to audit (by default all are monitored, but also it can be further configured), and the policy that is formed earlier.

Audit rule

This modular approach to configuration is fairly effective, and once set up the structure easily changes in any of these components. In essence, the configuration components (somewhat awkwardly named list in the user interface) form one audit policy, which is then allocated to the audit rule on the specified server or servers, and the corresponding user (or users).
Users are defined by the User Group option. Here we can create groups of users who we want to associate with the proper policies for auditing. Groups that are formed here are related only to the application itself and are not visible outside. It is especially nice that you can take users directly from Active Directory, and in the same place you can associate audit policy to the new groups, which shortens and eases configuration.
The console settings also allows you to configure alerts, which can be sent via email or SMS, in case of an event that is defined by a query, and it is possible to do a backup (and restore if necessary) the configuration. Given that the full configuration of the software can require quite some time, I advise you to be sure to do a backup.

The second part of the management console is designed for reporting, as a result of what is configured. This part is based on SQL Server reporting, which has to be defined during the software installation. Reports are pretty clear and easy to read, even though the console itself (similar to the one in Event Log Manager) seems a bit archaic. It is interesting that this application layout can be changed by a variety of layouts (eg, Windows XP, Office 2007, Visual Studio, etc), which is not particularly useful, but it’s cute.

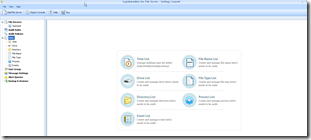
Reports console1
Predefined reports provided allow the display of all the changes, the changes that apply only to read (successfully and unsuccessfully), to create files and folders (also successfully and unsuccessfully), and modifications that occur on any resource, as well as modification of the permissions on files and folders ( SACL and DACL). Each report can be further defined with filters such as time, server, users, files, folders, processes, and specific events. In essence, the filter can use any configurable parameter that we discussed earlier. In addition, it is also possible to create custom reports.

Conclusion

LepideAuditor for File Server is a very useful piece of software. It doesn’t take much resources, nor it has complicated configuration. There are few things that should be improved (like terminology in console, and graphical interface) but, what’s most important, it does the work. More information about this product can be found at Lepide portal.

Lepide Event Log Manager–All in one place

Log management in general, is the essential topics for every system administrator. For any environment that has more than a couple of servers, centralized control and management of log files is a very important and significantly reduces the time that is spent on the administration of the systems in general. Searching through event logs on multiple servers is generally very time consuming job, and besides, it is quite often that some of the important information slips.
Solutions like System Center Operations Manager, for some organizations, are too complicated and too expensive, and quite often, in such cases the true tackle some third-party solutions that can surprise at their quality and functionality.

Lepide company, relatively unknown in our local market, is offering a very solid solution for centralized event log management. Their Event Log Manager is focused on the Windows event logs and W3C event logs (access logs of web servers), and present a very good solution for smaller to medium companies, who need an affordable, simple and functional solution for log management.

Lepide Event Log Manager is relatively little tedious and quite easy to use. You can install it on any Windows Server (supported by all newer than Windows 2000) or on a workstation that runs Windows XP or newer OS. In addition to the log management component, it requires the presence of SQL Server on the local or any other computer on the network. Fortunately, it supports SQL Server Express Edition, which means you do not have to buy a license, but you can use this free version. Hardware requirements are minimal, and you can install log management application on any computer that has at least 2 GB of RAM, and has installed. NET Framework. The installation process is very simple, and consists of starting the setup procedure and answers to some very simple questions. Upon first launching the application it will be necessary to configure a connection to SQL Server, which is a mandatory step before using the software. If SQL Server is installed on another computer, make sure that the SQL connections ports open and that you use account that has privileges to create a database.

Once the database connection is configured, you can continue to work in the console. It is advisable to first create groups of servers that are being monitored, and choose the method of collecting logs. The system can operate on agent and agent-less mode. Work in agent mode requires the deployment of agent software to the target computers, but it provides some more information from a computer that is monitored. While carrying out the primary configuration software, which consists of setting parameters for the SQL Server and the mail server (optional, if you want alerts and reports sent by e-mail), you must also add the computers and servers that are being monitored, possibly to form groups, and after that the system is ready for operation. After the first collection of logs, administrator can start to use the console Event Log Manager, which is organized by functional tabs.
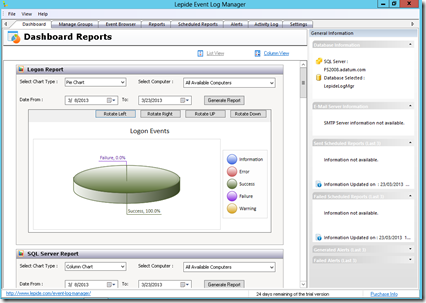
The first tab, called Dashboard, is a graphical overview of events that have collected in the last 15 days, for some well-known services, such as Logon reporting, SQL Server reporting, Exchange Server Report and the Report for the Service Control Manager. This tab can be seen as the rapid examination of whether some of these critical services have had problems in recent time. Useful, it would be nice if can be customized, but in this version of the dashboard layout is fixed.
Dashboard
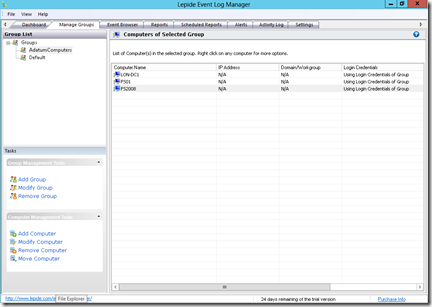
The next tab is used to manage groups. You can create groups of computers whose logs monitor, and besides, you can also add servers and computers. To view the logs in the rest of the console, it is necessary to add the resources here.
Groups
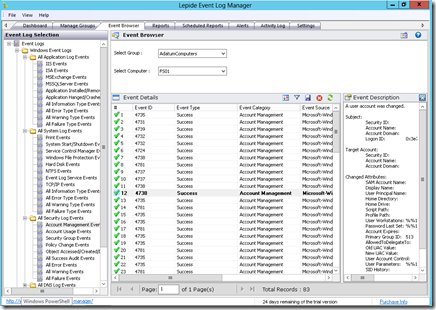
Event Browser tab is a "giant" event viewer. Here, it is possible to examine individual event logs on any PC that we follow through Event Log Manager. Logs are sorted into groups, and each group can select the log source server that we are interested in, and get a list of logs from that source. This approach is somewhat clearer than the traditional event viewer as logs within the group are further classified by type (eg, within the group we have the System Log Events log types such as Print Events, Hard Disk events, TCP / IP events, etc).

EventBrowser
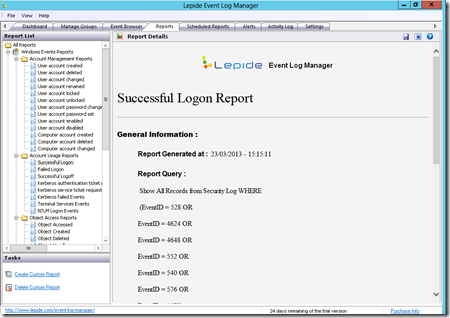
Reports Tab is perhaps the most important in the whole story, because it allows a very detailed overview of the state, filtered by the type of events that we have been interested. Most of time, administrators search logs for a specific event, so the report that groups logs by event is quite useful. For example, it is possible to get a report on the events lock user accounts in the last 7 days. Or report that will show all the events of a successful or unsuccessful logins. In the application, there are already a few dozen pre-designed reports that can be easily run, but it is also possible to create your own custom logs. Each report can be exported in HTML or PDF format, which is a very useful feature, especially in cases where these reports are forwarded for further review beyond the IT department. Reports can be generated manually and automatically. If you want to run reports automatically, then you should create an appropriate schedule object. Reports generated by the schedule, are sent via email, which is also a very suitable option.

Reports
As you would expect from software of this kind, options are also available to create alerts. If you have an event in one of the systems you track is particularly important, software can generate alert that will notify you via email when the log records the occurrence of a certain event type on some of the servers that are being monitored. The only method of notification is by email.
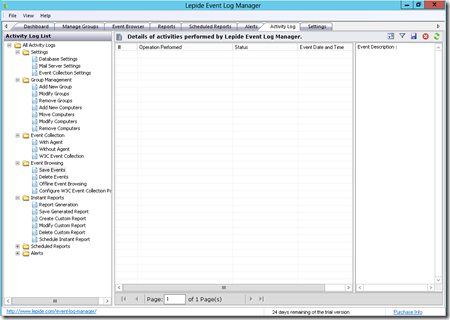
In the end, Event Log Manager allows and logging activities on himself. All that you are doing within this software will be logged to its own log and available for review through the Activity log tabs in the application itself.

Activity Log
Event Log Manager is definitely the software that needs to be taken into consideration if you need this type of service in your organization. Somewhat archaic console and some functionality that should be added, definitely leave room for improvement, but this version is quite usable. I tested it with both Windows Server 2008 and Windows Server 2012 servers and it worked fine, although Windows Server 2012 is still not officially supported.

Event Log Manager can be purchased through subscription or through licensing by the number of monitored servers, on which more details can be obtained on the Lepide web site.

(off topic)–New page for students and math lovers

As said in title, this is off topic post, but since I’m also mathematician (although not working with math for quite a long time), I want to give some visibility to the project that my wife Manuela (who’s a professional mathematician) started recently.

She decided to start a web page primarily to help students prepare for exams in math subjects that she teaches on Faculty of Science (Math department) in Sarajevo. She already published quite a few practices and exam examples, as well as some of her work.

I sincerely hope that more teachers from faculties and schools will take this path also.

If you want to take a look at the page, or just give some more visibility to this project, here is the link to Manuela’s angle.

System Center 2012 Service Manager Cook Book–giveaway!

Anyone interested in System Center Service Manager 2012, is likely to find interesting new Service Manager Cookbook, published by Packt Publishing and written by several MVPs and MCT, the experts in this field. Since Service Manager 2012 is much more than just another product from the System Center family, and you definitely can’t just click it through, it is more than advisable to consult the literature of this type before entering the stage of planning and deployment. The book therefore begins with the story of a rather non-technical ITSM Framework and processes, ITIL, Asset Management, Service Request, Incident and Problem Management and the IT Service Desk processes and operations. The first chapter ends with a discussion of service level management, which is a very important component. The rest of the book is divided into 11 chapters and two appendices, deals with the administration and configuration of Service Manager 2012, from the standpoint of its individual components and resources they manage, but also on the processes that are carried out within a manageable IT infrastructure. It ends with a chapter on the automation of processes through the Service Manager which is probably what everyone aspires. Very valuable source of information, I recommended this!

Microsoft System Center 2012 Service Manager Cookbook

I’m very pleased to announce that I have teamed up with Packt Publishing and are organizing a give away especially for readers of by blog. All you need to do is just comment below the post and win a free copy of Microsoft System Center 2012 Service Manager Cookbook. Two lucky winners stand a chance to win an e-copy of the book. Keep reading to find out how you can be one of the Lucky One.

How to enter drawing?

Simply post your expectations from this book in comments section below. You could be one of the 2 lucky participants to win the e-copy.The contest will close on 18/01/13 . Winners will be contacted by email, so be sure to use your real email address when you comment!